Last month in markets
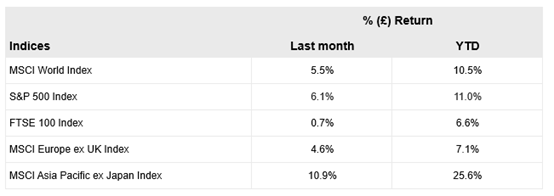
- After a strong April, equity markets pushed higher in May with the benchmark MSCI World Index rising a further 5.5% in sterling terms.
- The rally was supported by some strong earnings announcements (see the later section in this report) and by optimism over the prospect of some resolution in the US-Iran conflict, which sent the oil price more than 10% lower over the month.
- Technology and AI-related stocks continued to lead the way, with the ‘SOX 7’ (the largest companies in the PHLX Semiconductor Index) at the forefront in terms of performance. As was the case in April, technology-heavy indices such as the US, Korea and Taiwan again benefitted most and outperformed the UK and eurozone, where economic data continues to disappoint.
- The Japanese market also performed strongly, with the Topix rising c.6% in sterling terms. In addition to the optimism over some progress in the Middle East conflict, investors were buoyed by some strong economic data suggesting that new prime minister Takaichi’s growth policies could be taking effect.
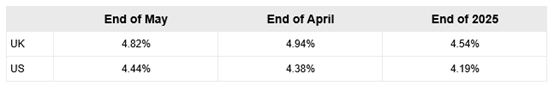
- CPI inflation (which includes energy prices) rose significantly in the US to 3.8%, and also in the eurozone, where it rose to 2.8%. UK CPI is also expected to rise further from its April level of 2.8%. Despite this, global bond indices produced moderately positive returns in May. Optimism over some resolution in the Middle East conflict, and an implied lower inflationary impact looking ahead, sent UK and eurozone yields lower (and values up). Credit markets also remained firm given the positive corporate news-flow globally.
Equities
10-year government bond yields
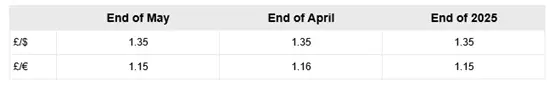
Currencies
Source: FactSet and Morningstar as at 31 May 2026. Past performance is not a guide to future results.
US market breaks through 7,600 for the first time
Since the Iran-conflict-led market falls in March, the S&P 500 has surged ahead to new highs. A key question is therefore how concerned we should be about current valuations.
Taking a high-level view on this, the ‘earnings yield’ of the market (dividing the earnings by the price) has actually risen since the conflict began, implying the market rise has been fully justified by an exceptional earnings season (and that the market is now effectively ‘cheaper’ than it was pre-conflict on a forward price/earnings basis).
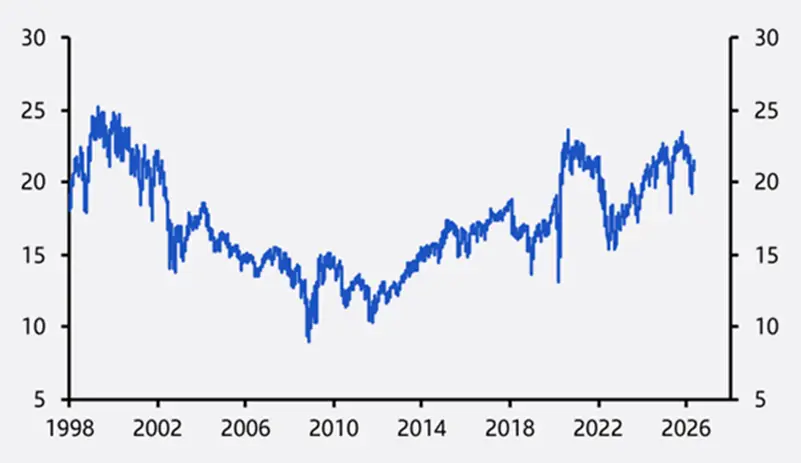
Looking at the ‘equity risk premium’ however, i.e. the above earnings yield relative to the real yield available on bonds (10-year US TIPs), this has fallen to c.2.5, which could be a cause for concern although we note that it has been at this level for some time and is not at the extreme (negative) level seen before the tech bubble burst in 2000.
S&P 500 ‘equity risk premium’
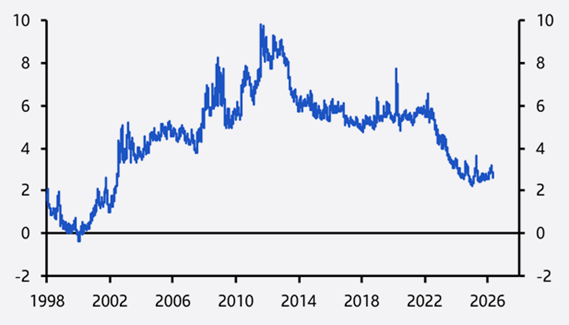
Source: LSEG, Capital Economics, June 2026.
Looking at the market on a simple price/earnings basis, this also doesn’t look alarming, as the recent surge in earnings has lowered this to c.21x.
S&P 500 forward 12 months (FTM) p/e ratio
Source: LSEG, Capital Economics, June 2026.
Although the latest corporate results season has delivered strong numbers across most sectors, technology-related sectors have seen the biggest earnings estimate uplifts. The chart below shows that technology earnings and price/earnings ratios moved broadly in line from 2022 to the middle of last year, but earnings have since surged ahead and valuation multiples have ceased to keep up. For the rest of the market, the chart also shows that valuations have simply moved broadly in line with earnings over the same period
S&P Tech and Rest of Market forward 12-month (FTM) earnings and p/e ratios
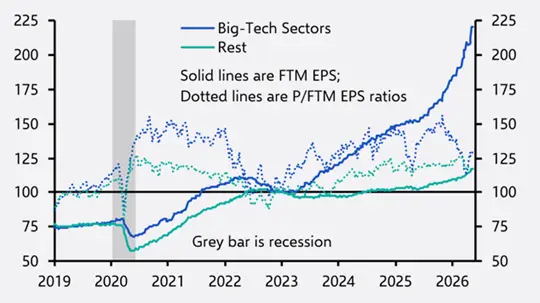
Source: LSEG, NBER, Capital Economics, June 2026.
Conclusion
As the market prepares for giant IPOs in the shape of SpaceX, Anthropic and OpenAI, and a rare period of potential net equity issuance given the scale of them, the onus is certainly on monitoring the macroeconomic outlook and the sustainability of current earnings forecasts.
Our conclusion from the above however is that valuations in the US (and most other key markets) do not look stretched based on current fundamental factors.
This page is issued and approved by Bordier & Cie (UK) PLC (‘Bordier UK’). Incorporated in England No: 1583393, registered address 23 King Street, St James’s, London, SW1Y 6QY. The company is authorised and regulated by the Financial Conduct Authority (‘FCA’).
Bordier UK is a wealth and investment manager dedicated to providing portfolio management services. We offer Restricted advice as defined by the FCA, which means that if we make a personal recommendation of an investment solution to you, it will be from Bordier UK’s range of investment propositions and will reflect your needs and your approach to risk.
This page is not intended as an offer to acquire or dispose of any security or interest in any security. Potential investors should take their own independent advice to assess the suitability of investments. Whilst every effort has been made to ensure that the information contained in this page is correct, the directors of Bordier UK can take no responsibility for any action taken (or not taken) as a result of the matters discussed within it.


